
Additional Resources
Catchment Loads and Yields by Region
Select detail below to display catchment loads on the map:
The map displays sediment, nitrogen and phosphorus loads and yields for Great Barrier Reef and South-East Queensland catchments. Loads are calculated using monitored data and are reported in kilotonnes (kt) for sediments and tonnes (t) for nutrients. Yields are reported as t/km2 and kg/km2 for sediment and nutrients, respectively.
Additional Resources
3. Selection of:
Chart information:
This chart displays the load/yield for the selected analyte (bar) and the discharge (blue triangle) over selected monitoring years or sites.If the bars are not clearly visible for specific years or sits due to significant differences between values, you can view the bar chart with a log-scaled y-axis.
Chart information:
This chart displays the relationship between loads and discharge for a monitoring site over time. A black line is included to indicate the linear model fit for the relationship.
Chart information:
This chart displays the load/yield for the selected analyte (bar) for monitoring sites within a basin. If the bars are not clearly visible for specific years or site due to significant differences between values, you can view the bar chart with a log-scaled y-axis.
How to explore these data
There are two main pages to explore data: the Map page and the Data Explorer page.
- The Map page is useful to explore where loads data are located within Queensland within a map interface. Select your analytes of interest in the panel on the left for the map to update.
- The Data Explorer page is useful to filter and display data by region, site and year.
Map
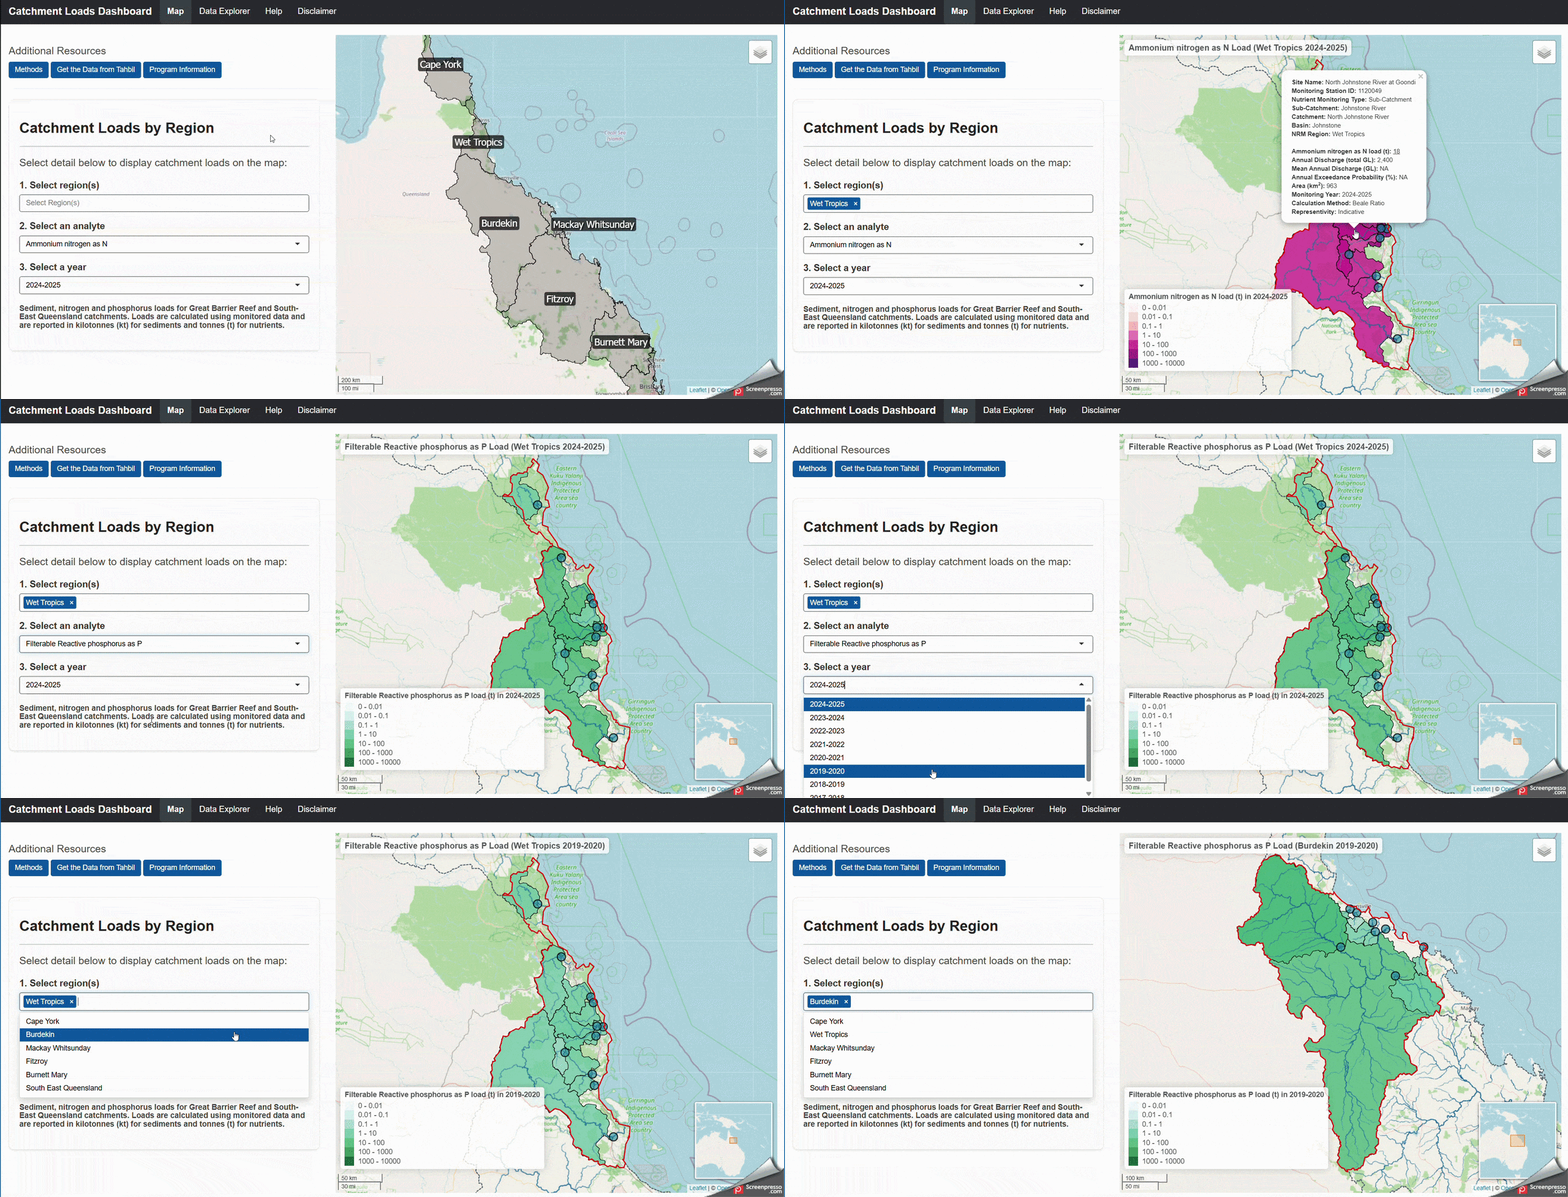
The Map tab is useful to explore where catchment loads data are located within Queensland within a map interface.
The map displays all loads regions as defined areas on the map. You can zoom into areas of interest and loads sites will appear. Hover over the blue site dot for the site name and ID to appear.
Selecting the following form the drop-down menu in the left panel to interact with the map:
- A region (or regions)
- An analyte
- A reporting year
NOTE: The map will only be refreshed when all three of these drop-down menus are selected by the user.
Upon selection of these three inputs, the map will be updated to show loads data for your region/s, analyte and reporting year.
You can interact with the data in the map by clicking on the loads data (represented regionally) to access more information.
You can continue to change any of these inputs, and the map will re-load to show loads data for your inputs. To clear the filters and return to the original overview map, de-select all regions from the 'Select region/s' drop-down menu. Natural Resource Management (NRM) regional boundaries are used to select a region of interest. Loads are displayed at a basin scale.
Loads visualised on the map are representative of the upstream catchment area of a given monitoring location. Smaller catchments are layered on top of larger ones, as such if you find a coloured area is showing a pop-up 'Load Data is not available' this may indicate a subcatchment of a larger basin was unable to report loads, while the downstream site was able.
Data Explorer
The data explorer tab features interactive plots that allow end users to engage with the data.
These visualisations are built using Plotly, an interactive graph interface which allows users to explore the data in several ways. Users are able to change any of the inputs at any time, and the graph will update to show the selected inputs. Please refer to the Plotly Help Page for further information.
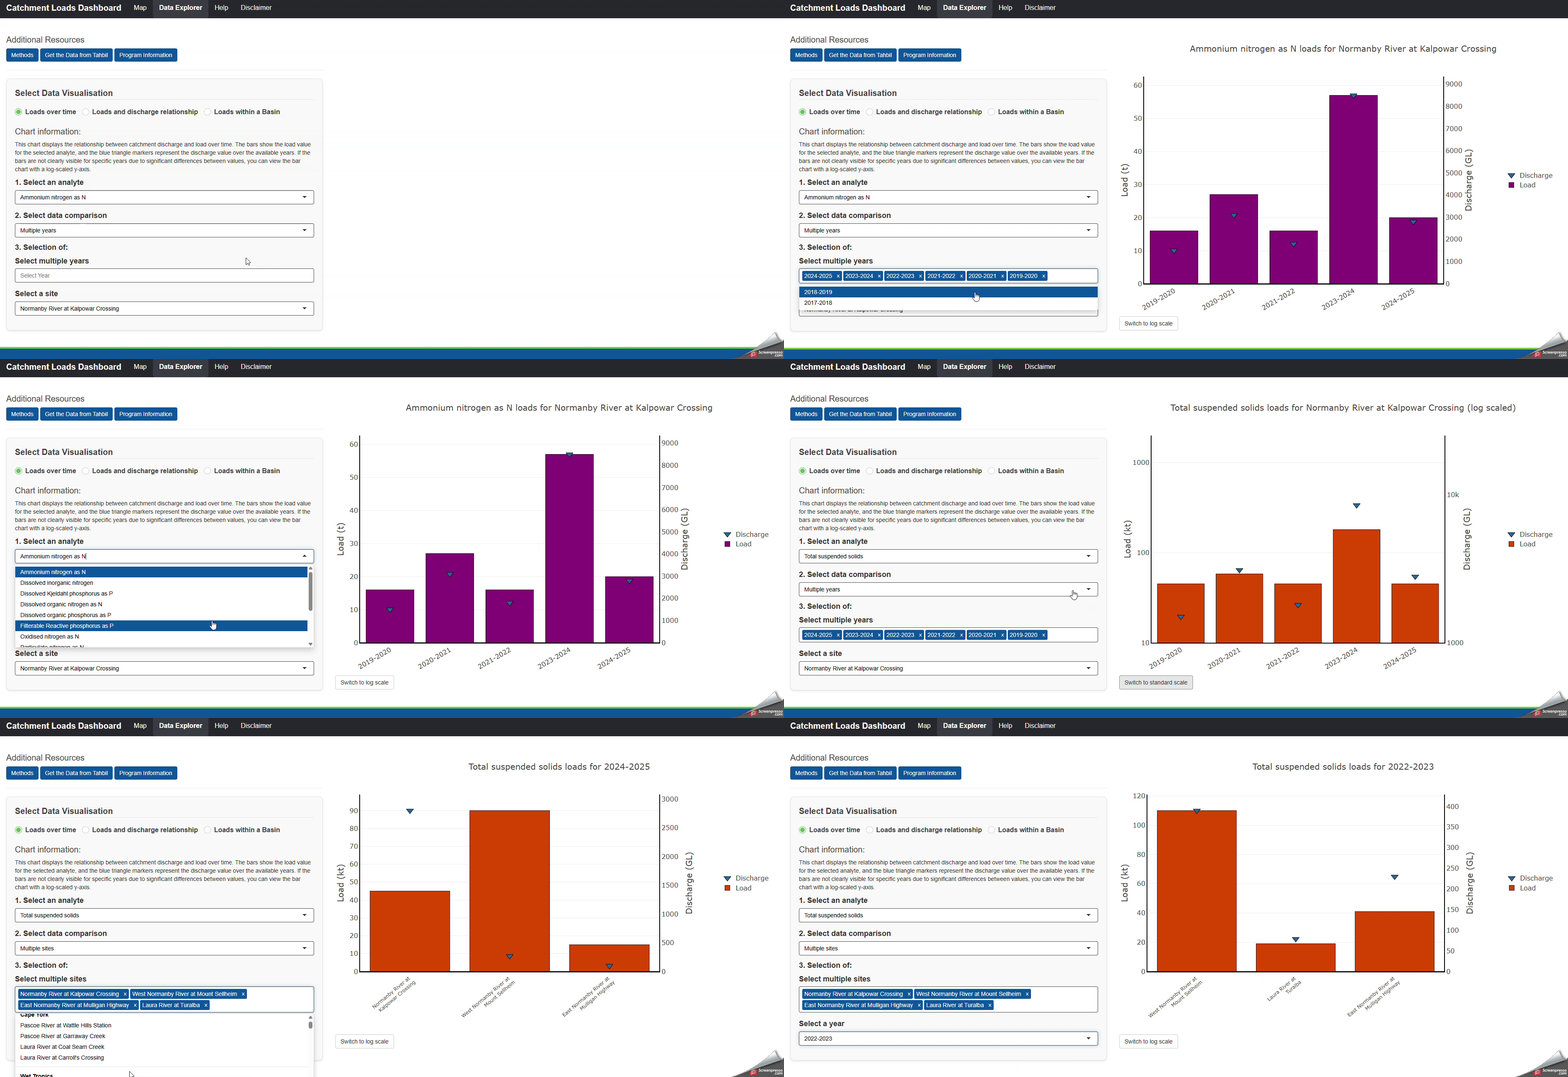
Loads over time graph
The Loads over time graph displays the relationship between discharge and load over time. The bars show the load value for the selected analyte, and the blue triangle markers represent the discharge value over the available years. A user is able to select two modes for this graph - the ability to see an analyte over multiple years, or the ability to see an analyte over multiple sites. Hovering the mouse over bars on the graph reveals additional data for the user. If the bars are not clearly visible for specific years due to significant differences between values, you can view the bar chart with a log-scaled y-axis, by selecting the 'Switch to log scale' button at the bottom of the chart.
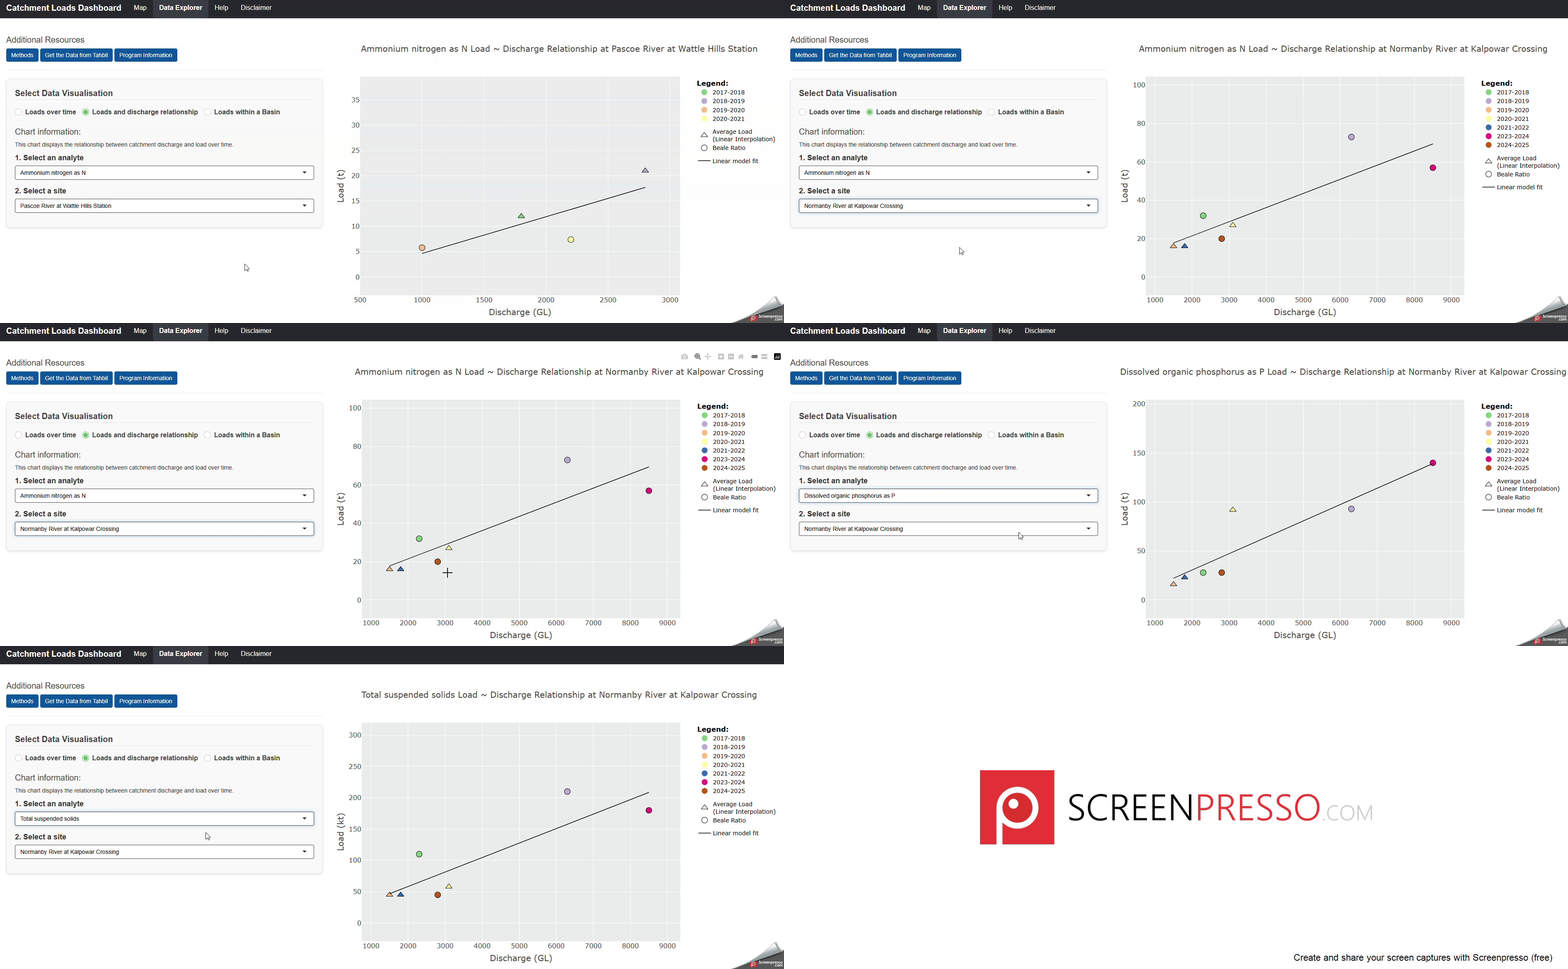
Loads and discharge relationship graph
The Loads and discharge relationship graph displays the relationship between discharge and loads over time. This graph requires an analyte and a site to be selected. Users are able to switch off the Linear model fit by clicking on this item in the Legend. This graph will generate using only 2 data points, however the smaller the number of data points available, the less indicative the Linear Model fit will be. Hovering the mouse over points on the graph reveals additional data for the user.
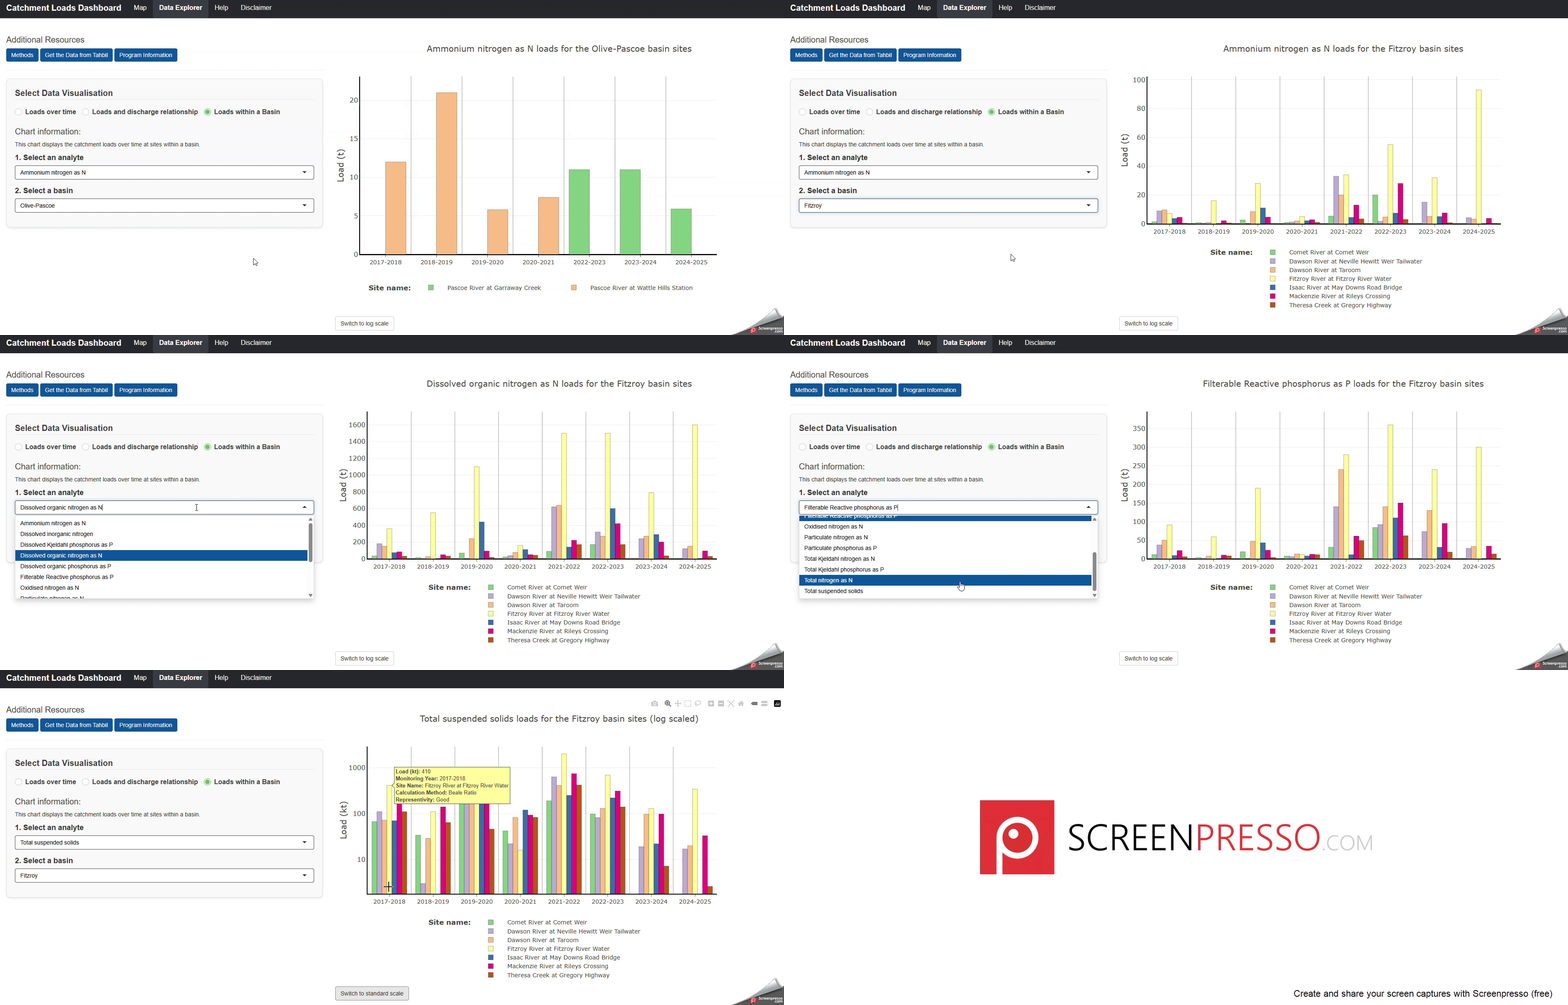
Loads within a basin graph
The Loads within a Basin graph, show the loads information broken down per site, grouped by the Basin they are within. A user is required to select an analyte and a basin for the graph to load. Hovering the mouse over bars on the graph reveals additional data for the user. If the bars are not clearly visible for specific years due to significant differences between values, you can view the bar chart with a log-scaled y-axis, by selecting the 'Switch to log scale' button at the bottom of the chart.
About the Data
The sampling quality rating (representivity) is assessed against two criteria: the number of samples collected in the top five per cent of annual monitored discharge, and the ratio between the highest discharge at which a water sample is collected at a site in a year and the maximum discharge recorded in that same year. These two criteria combine to provide a quality rating for the calculated load and yield. Hydrographs are also visually inspected to validate the quality ratings. Loads and yields with ratings of ‘Excellent’, ‘Good’ and ‘Moderate’ are reported publicly alongside their quality rating. Sites with too few concentration or validated flow data, or with a quality rating of ‘Indicative’ are non-reportable and are not made publicly available. Where a load is non-reportable, the associated yield will also be non-reportable.
Loads
Loads are the estimated mass of monitored analytes (nutrients and sediment) transported past a monitoring site and are expressed as kt for sediment and t for nutrients. Concentration and flow data were used to determine the load of nutrients and sediment transported past the monitoring site in each catchment or sub-catchment.
Yields
Yields are the average rate of monitored analytes delivery across a monitored catchment area and expressed as t/km2 and kg/km2 for sediment and nutrients, respectively. Yields are calculated by dividing the monitored annual load of each analyte by the total monitored catchment area, which provides a useful means of comparing the rate of pollutant delivery between catchments of varying sizes.
Glossary of Acronyms
- GL - Gigalitre
- kt - Kilotonne
- N- Nitrogen
- P- Phosphorous
- t - Tonne
Additional Resources
The Catchment Water Quality Alliance (Alliance) is a dynamic partnership that brings together the expertise of government and academia to tackle water quality challenges in Queensland. To find out more about our program please have a look at our Hub website.
Please find additional information to understand and access the data at these links.
- The Method button will take you to the Tahbil - Water Quality Data Portal: Analyses, Quality and Methods for Calculating Pollutant Loads/Yields and the Pesticides Risk Metric document. This document provides information on the annual load calculation methods, as well as other pertinent information explaining the data available within this application.
- The Get the Data from Tahbil button will direct you to the Tahbil website to download and access the data shown within this application.
- The Program Design button will take you to the Great Barrier Reef Catchment Loads Monitoring Program Design. This document provides information on the program that captures the data shown within this application.
Contact
For more information about the Great Barrier Reef Catchment Loads Monitoring Program please contact wqi@qld.gov.au
Disclaimer
This dashboard displays reportable sediment and nutrient pollutant loads and yields for waterways monitored by the Catchment Water Quality Alliance.
The dashboard provides several ways to explore the data:
- Through a map interface that can be filtered to a single analyte, a sampling year, and the selected regions.
- Through graphical plots, showing the breakdown of loads and yields across sites, regions, sampling years, and analyte types.
- For reporting purposes, all loads and yields data are rounded to two significant figures.
- Yields represent the load normalised by the catchment area, allowing comparison of pollutants across catchments of different sizes.
- All loads and yields data provided in this dashboard are based on the best available discharge data in the year of calculation. These data are occasionally subject to revisions that may not be represented in this dashboard.
- The map only displays reportable loads and yields for subcatchments in a given sampling year. Non-reportable loads and yields are excluded to ensure clarity and relevance.
- Discharge data in the plots are obtained from a range of sources and may not come from the same site that loads are calculated from.
- All reportable loads and yields are available for download in tabular format from Tahbil – Water Quality Portal (opens in a new tab).
More information about the loads methodology can be found in the “Methods” and "Program Information" buttons.
Due to improvements in data quality coding and calculation methods, the loads and yields presented in this dashboard may not be identical to previously documented values.
Although every effort is made to ensure the accuracy of the data, the Department of the Environment, Tourism, Science and Innovation makes no representations or warranties about its accuracy, reliability, completeness, or suitability for any particular purpose and disclaims all responsibility and all liability (including without limitation, liability in negligence) for all expenses, losses, damages (including indirect or consequential damage), and costs which might be incurred as a result of the information being inaccurate or incomplete in any way and for any reason.